The OSP Data Tool is used for analysis such as curve fitting.
A graph reveals much about the behavior of a model but the precision of on-screen measurements is limited. There are two approaches to obtaining better data analysis. We can program the analysis ourselves within the model or we can use a general purpose data analysis tool. The Euler Falling Ball Analysis model introduces the Data Tool to analyze Euler's numerical method solution of the fall particle model.
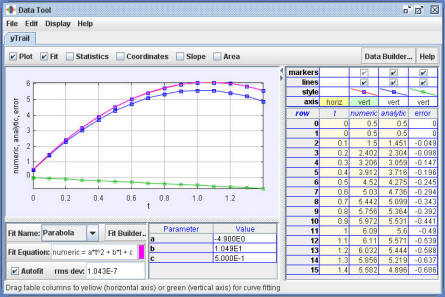
Run the model with a time step Δt=0.1to generate time-series data and click the newly added tool button to show the Data Tool. The table columns display the numeric and analytic solutions. You can change the tool's display by clicking on the style file above the data column. You can right click on the tab to create additional data tabs.
Note that you can change the graphical display by clicking on the style field above the data columns. You can also right click on the tab to create additional data tabs and delete unnecessary columns so as to simplify the Data Tool display.
Online help for the Data Builder and for non-linear
The following EJS models are described in Chapter 2.
The Euler Falling Ball Analysis model was created by Wolfgang Christian using the Easy Java Simulations (EJS) modeling tool version 4.1. You can examine and modify the model for this simulation if you have Ejs installed by right-clicking within the program and selecting "Open Ejs Model" from the pop-up menu.
Information about Ejs is available at: <http://www.um.es/fem/Ejs/> and in the OSP comPADRE collection <http://www.compadre.org/OSP/>.